Investing General Discussion
- Thread starter Furious
- Start date
You are using an out of date browser. It may not display this or other websites correctly.
You should upgrade or use an alternative browser.
You should upgrade or use an alternative browser.


- 49,428
- 134,281


Walmart In The Metaverse? Coming Soon Thanks To This Gaming Company
Leading retailerWalmart Inc(NYSE:WMT) is making a big bet on the growth of the metaverse with a partnership with leading metaverse and gaming companyRoblox Corporation(NYSE:RBLX).
What Happened: Walmart announced the launch of Walmart Land and Walmart's Universe of Play on Monday.
Roblox users will be able to unlock exclusive content, check out exclusive Walmart virtual areas and see top artists perform with the new partnership.
Walmart will use its Universe of Play as a virtual toy destination, coinciding with the upcoming holiday shopping season.
- 49,428
- 134,281
Jackie Treehorn
<Gold Donor>
- 3,404
- 9,268

I bonds — TreasuryDirect
 www.treasurydirect.gov
9.62 percent on I bonds right now, up to $10,000.
- 5

- 1

- 49,428
- 134,281
This is not investing advice but... TSLA getting close to the 100 DMA. It has only breached the 100 DMA once in the last 5 years.

- 49,428
- 134,281
What better time to cull the weak than when the entire market is in the shitter? Who'll notice.
 finance.yahoo.com
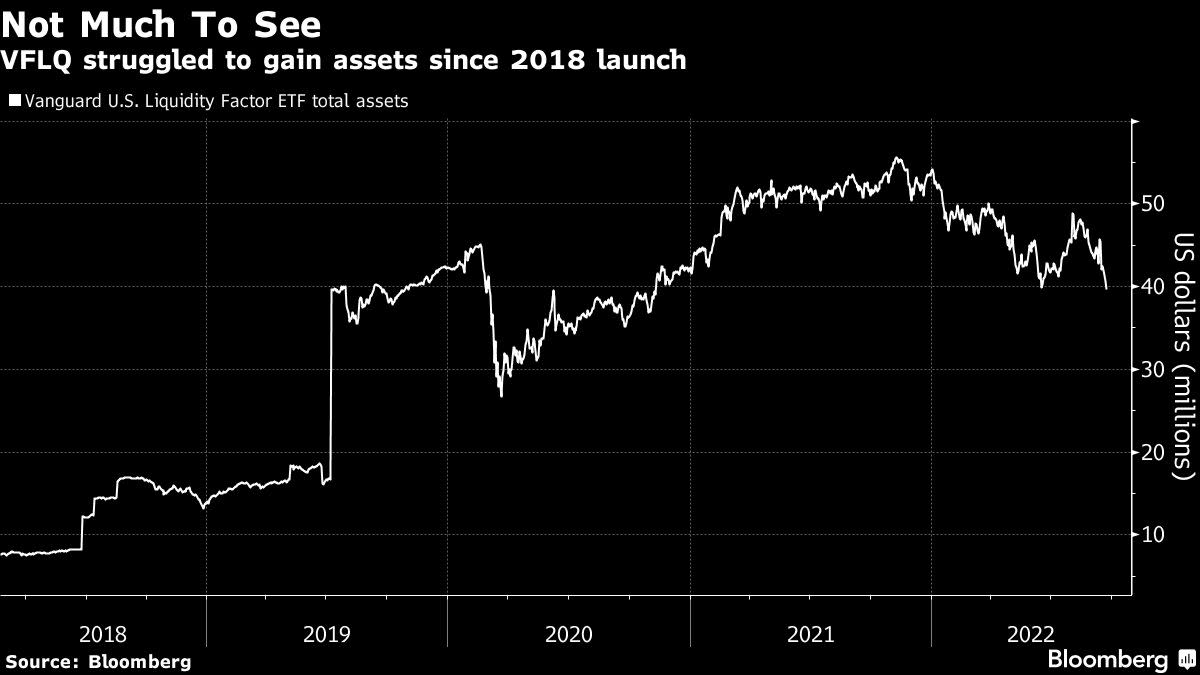
Vanguard Is Liquidating a US-Listed ETF for the First Time Ever
(Bloomberg) -- Asset-management giant Vanguard Group is shutting down one of its US exchange-traded funds for the first time. Most Read from BloombergJohn Paulson on Frothy US Housing Market: This Time Is DifferentUK Market Selloff Slams Gilts, Pound, Piling Pressure on BOEWall Street Banks Prep...
- 7,689
- 38,080
you're showing the 100 week not 100 day just to be clearThis is not investing advice but... TSLA getting close to the 100 DMA. It has only breached the 100 DMA once in the last 5 years.
View attachment 434984
- 49,428
- 134,281
Eh? Crap, how did that change? I always keep the 50/100/200 DMA charted. Hmm.you're showing the 100 week not 100 day just to be clear
- 1
- 49,428
- 134,281
- 49,428
- 134,281
I just looked at it. That was a five year chart with the 50/100/200 day simple moving average. I swapped to the 2 year chart and the values are the same. Same with a 1-year chart.you're showing the 100 week not 100 day just to be clear
Gravel
Mr. Poopybutthole
- 47,711
- 172,833

Almost a half a percent yield curve inversion? What's the largest it's ever been?
- 49,428
- 134,281
Looks like 200 basis points during Carter's stagflation.Almost a half a percent yield curve inversion? What's the largest it's ever been?
The Inverted Yield Curve in Historical Perspective – Finaeon
- 1
- 49,428
- 134,281
So rare these days to see the S&P 500 more red than the Nasdaq. AAPL squeaked out a green day. That closing waterfall from 3:55 onwards into the close was shit.
- 1

- 7,689
- 38,080
It's weekly, not sure what you are looking at. It's a weekly chart and those are weekly moving averages. You can see right at the bottom it says "frequency weekly" . I verified those are the weekly moving averages. If you add MA to a chart they automatically adjust to whatever frequency you are looking at. So you set up a 20 MA. If you look at a daily chart it's a daily ma if it's monthly then it would be a monthly MA and so on. All of TSLA's current daily MA's are huddled in the 290 area.I just looked at it. That was a five year chart with the 50/100/200 day simple moving average. I swapped to the 2 year chart and the values are the same. Same with a 1-year chart.
- 1

- 49,428
- 134,281
Fair enough. So you cant use MAs on long historical charts since it wont allow say a 5-year chart to display in days?It's weekly, not sure what you are looking at. It's a weekly chart and those are weekly moving averages. You can see right at the bottom it says "frequency weekly" . I verified those are the weekly moving averages. If you add MA to a chart they automatically adjust to whatever frequency you are looking at. So you set up a 20 MA. If you look at a daily chart it's a daily ma if it's monthly then it would be a monthly MA and so on. All of TSLA's current daily MA's are huddled in the 290 area.
- 49,428
- 134,281
This is why its good to have farmer Blazin back. I need to learn stuffs.
- 1
- 7,689
- 38,080
I do all my charting in TOS because it makes doing this easier. I don't know if its possible in Fidelity but if it is it's probably a pain.Fair enough. So you cant use MAs on long historical charts since it wont allow say a 5-year chart to display in days?
- 7,689
- 38,080
Here is the daily chart for the time frame you wanted, showing Daily MAsThis is why its good to have farmer Blazin back. I need to learn stuffs.
- 1
- 49,428
- 134,281
Thats probably why I didnt realize this. If you have a YTD chart up (daily) in ATP and change the date to 5-year it automatically changes the timeframe to weekly. If you manually change the timeframe back to daily it automatically adjusts the dates to the max possible showing Daily.I do all my charting in TOS because it makes doing this easier. I don't know if its possible in Fidelity but if it is it's probably a pain.
Share: