IT/Software career thread: Invert binary trees for dollars.

Vinen

God is dead
2,783
489
Well I've applied anyways. If they offered and the pay was right I'd come back happily. Don't know how dell influenced the culture. The job I'm applying for lists bios experience and firmware so hopefully my resume will stick out to them. They did say when I left that id be welcomed back.

Pay would need to be 10%+ over what I make now and at the senior engineer level.

My only worry is I havent done fuck all here outside one major year long project. I'd have to really pretend I did more than I have.

Told you that you'd do nothing at a Defense Contractor LEL.
 

James

Ahn'Qiraj Raider
2,804
7,056
Working on a new project for our VP of supply chain, he wants me to make an ER diagram of the program I'm going to write for him before I start writing it, but I don't know shit about making an ER diagram. I've been reading about it all day, but when I start putting it down on paper it seems empty and incomplete without a shitload of accompanying explanation. Anyone have any books/sites to recommend to learn about making ER diagrams?
 

Lendarios

Trump's Staff
<Gold Donor>
19,360
-17,424
Some more info required, ER diagram of your sales process? Products?

I understand ER diagram to mean the relation among the database elements of an application.

Is that what you are looking for?

Can you give us a verbose description of what will your application modify / see so we can build a better table diagram.
 

TJT

Mr. Poopybutthole
<Gold Donor>
40,993
102,945
James James so in the tech world most of us would see Database Schemas for our ER diagrams. But its sounding like your ER diagram needs to be a bit more loose. In between an ER and a flowchart.

I know nothing about your business so help a brother out here. Just start small and build off of each step. Do the most basic outline first then fill in edge cases and things that can derail the process.

In order to make your widgets....
  1. Order of raw material -> Order numbers, quanity, transportation mode, cost, quality, grade, any other details you can think of.
  2. Fabrication (interim piece)
  3. Customer -> Address, name, house number, emailid, etc

Just go through every piece of your workflow and how it pertains to the next piece. That is how you make them. I've made tons of database schemas.
 

Lendarios

Trump's Staff
<Gold Donor>
19,360
-17,424
1539116049866.png


This quick example will help you see the two most common relations whip types. One to may, and many to many.

Standalone entities
For example, On the above diagram, you can have location data entered directly on the locations Table. This data can exists by itself and does not require any other extra piece of data.
The same as the Presidents table, you can have records there, and they don't depend on anyone else else. The most important value on standalone entities is the Primary key, as this is the key that other data will point to. You can only have one Primary key per table.

One to Many.
If I were to enter data on the Agents Table, I would need to enter the "ApprovedBy" field. This is the president ID who approved the agent. This makes the "ApprovedBy" field the Foreign Key. You can have multiple foreign keys on the same table, each pointing to a separate table. On the spoiler, you will see how an agent now has a location, which is the office where they work from. You only need two tables to represent a one to many relationship
1539116542245.png

Many to many
Lets say that one or multiple agents are in charge of surveillance on a particular location, In that case, we need a "link" table, something that links the multiple agents with the multiple locations. Enter the "surveillance list" table, this link table contains the ID of the agents, and locations that each one is spying on.

You always need at least 3 tables with many to many, the two sources and the link table. The link table is basically a table containing foreign keys

These are the others types of relationships, the legend depends on which software/ standard you are using.
1539116974245.png


As an exercise, try replacing the values from the above diagram, into the ones that have the keys and infinity symbols.
 

Lendarios

Trump's Staff
<Gold Donor>
19,360
-17,424
This is how it will sort of look on draw.io
1539117629179.png


Also ER diagrams are never the end all/be all. There are plenty of things that get added after the diagram is made, fields were not taken into account, requirement changes, etc.

Also ER diagram will often skip link tables on their representation, that is OK because link tables are more of a SQL implementation thing. BTW all my post relates to SQL.

If anythign just modify this one.

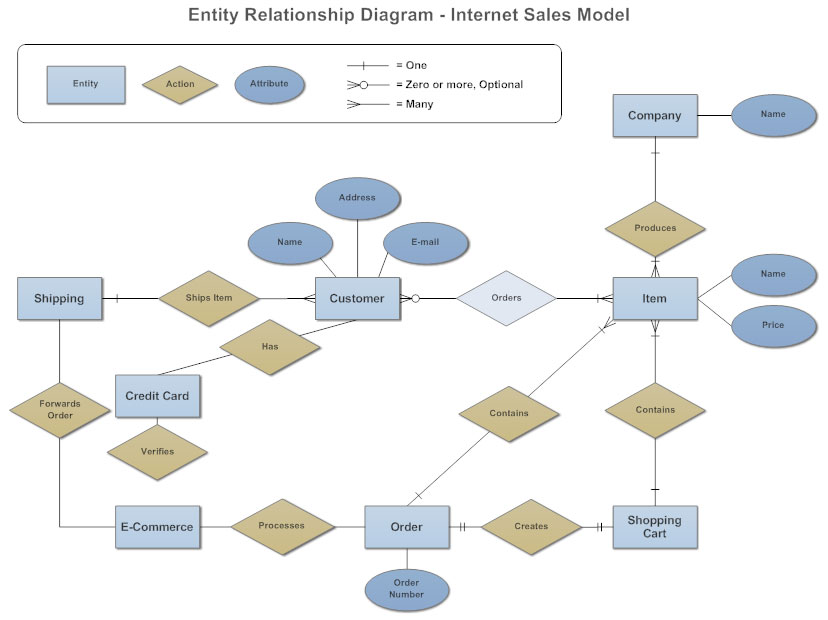
erd.jpg
 

a c i d.f l y

ಠ_ಠ
<Silver Donator>
20,060
99,460
Well I've applied anyways. If they offered and the pay was right I'd come back happily. Don't know how dell influenced the culture. The job I'm applying for lists bios experience and firmware so hopefully my resume will stick out to them. They did say when I left that id be welcomed back.

Pay would need to be 10%+ over what I make now and at the senior engineer level.

My only worry is I havent done fuck all here outside one major year long project. I'd have to really pretend I did more than I have.
If anything, EMC has influenced the culture at Dell more than the other way around.
 

James

Ahn'Qiraj Raider
2,804
7,056
So what we do is we sell metal building components, basically a big coil of steel comes in that's like 42-58 inches wide, and then it's painted and slit down to the dimensions needed for any particular component, e.g. MasterCoil 52" wide gets painted Light Stone and slit into 13.9375" slits that then get sent to a roll former that bends it into the correct shape. The program needs to keep track of a list of requirements, e.g. I need 20,000 lbs of 24 gauge 13.9375" wide Light Stone coil, from multiple customers so that we can figure out the optimum slit pattern for whatever coils need to be slit. I've got a little SQLServer database set up that shows these relationships and how they turn into a panel (criticism on this most definitely welcome), but the objects I need to work with to make a Slit Order are slim to none, I just need some customer requirements and a Slit Order class that collects all these requirements, slits, and coils.

So I've made a little diagram in LucidChart, but I'm not sure what's considered private, public, protected in a class diagram, nor how to represent state changes in my objects or how the data actually works beyond simple structure.

classDiagram.png


ERDiagram.png
 

Lendarios

Trump's Staff
<Gold Donor>
19,360
-17,424
Can you redo that diagram with proper spacing, Data types, and Make the table big enough so there are no scroll bars?

I think some of the relationships look redundant, also you have boxes going over the connections making it hard to read. Feel free to use multiple screenshots. Also what you maybe missing next is simply a flowchart, which dictates the action in the system.

You don't have to worry about private/protected/public at this stage, that is an implementation decision,.

Panel should be a much important object, Why is PanelName so important in comparison to Panel?
Are embrosing,/striation a property of Panel, or a property of PanelName?


What is a PanelName? Why does it has so many attributes? Maybe PanelDetails and Name is a property on that table.

A quick way of deciding what to put in tables /columns is.

My object XYZ has this attributes 1, 2 and 3. (table Name is XYZ and ,2 and 3 are columns on it.)
 
Last edited:

James

Ahn'Qiraj Raider
2,804
7,056
Eh, the SQLServer thing is mostly separate from this except for the fact that they both deal with coils. I've made the argument that we need to centralize ALL of this coil information so maybe they do eventually get looped in together, but I'm not sure my new boss wants me to go off into a tangent about how coils are created and entered into our system at this stage. What I've done so far is actually write up a simple program in Excel to make sure I have my objects interacting like he wants them to as a proof of concept, and things like that window on the bottom right I have *no* idea how to represent in an ER diagram -- it's the same objects, just a different view.

program.png
 

Kharzette

Watcher of Overs
4,935
3,586
The last page of this thread has been horrifying. I'm glad all I'm any good at is games coding.
 
  • 1Like
Reactions: 1 user

James

Ahn'Qiraj Raider
2,804
7,056
Panel should be a much important object, Why is PanelName so important in comparison to Panel?
Are embrosing,/striation a property of Panel, or a property of PanelName?

Temporary names, PanelName initially was something else, I just never changed the name. Essentially a panel is comprised of two parts: material and shape. The material comes from steel coils, and the shape comes from roll formers. The PanelName table represents the shape data, just what the roll formers produce (which includes embossing and striations). The Panels table simply combines the shape and material into a fully realized product -- it is the most important table, but it's just a combination of two previously defined objects.

EDIT: The PanelApplication tables are a huge mess cause I'm not sure how best to represent it in tables, but basically the shape of a panel can be used in a Roof, Wall, or Soffitt application, and each application contains further definition of the panel shape. Also, each application *can* (but usually don't) have sub-processes which even further define panel shape (e.g. Roof application has Exposed Fastener or Standing Seam, the former is just holes drilled into the panel and the latter is an entire clip system built onto the roof that the panel can attach to, a shape would never be both Exposed Fastener and Standing Seam, but again I had no idea how to represent it).
 
Last edited:

Lendarios

Trump's Staff
<Gold Donor>
19,360
-17,424
James James
I'm guessing you inherited most of this. As an advice try to be clearer about the names of entities representing more concrete things. For example PanelShape is a perfect name for that entity, because you can explain it easily, a panel shape has X Y Z property.

If something has a Type, and that type can only be x,y,z that can be represented by a lookup table with a foreign key to it.

If all your data can be separated into "types" then you will have several lookup tables that will be linked to your PannelShape table.

Start thinking into how to group the data. However I think your boss is giving the run around by asking you for the ER diagram, An ER diagram is used for implementation, not for management.

What management needs are Use case diagrams. (I'm going to make 4 up off the top of head with the information you given me)

Start with a problem, what are you trying to solve. pick your most simple case.

Use Case 1
As an employee of the company I need to go to a place, in there i will select the location to where the order product will be delivered, then I will select the measurements, material type, dimensions, type of slit, type of xyz. Then after all this data is collected an order is created and email will get fired to processing so the order can be processed.

Use case 2
As a processor, I need to go to place and review all the pending order, read the materials needed, check them out against inventory and make the widget.

Use case 3
As a shipper i need to track the order, so i need a place to where i can find the order and add to it a corresponding UPS Tracker.

use case 4.
As an inventory manager I need to see how many materials i have left in stock, and what has been my usage on the last week/month. I also need alerts if a materials stock falls behind a certain number, so i can buy more.


Use cases DRIVE the software, we basically are creating software to address them, they are the goal, the endgame. ER diagram is how we implement a solution to them, they come after we have scoped out what we want/need to do.

Start small, you seem very familiar with the business process, so start thinking, how can "the computer help me here? How can i go from 20 keystrokes to make an order, to 10 or even 5 mouse clicks.

Also an order entity is normally separated in the following components
Order table
OrderID
CustomerId
Shipping Information AddressID
Billing Information AddressID

OrderLineItem Table (each one is a line item)
OrderLineItem ID
OrderId
Product ID
Total $

The product ID is the link to the product you make, in your case a panel. (NOTE This is very cookie cutter and you may not need some of them at all).

Again focus on the problem you are trying to solve, write it out; explain to management why is it a problem, and how a computer software can fix it. The rest is the easy part =).

If you are wasting materials, then you need software to help you manage inventory. If orders are getting lost, then you need an order tracking system that fires emails, etc.
 
  • 1Solidarity
Reactions: 1 user

James

Ahn'Qiraj Raider
2,804
7,056
Yeah, I was just reading about how to write a use case, I'm gonna start with that in the morning. For some background, until just very recently I was by far the most experienced programmer on staff with literally 0 years professional programming experience, so there's almost nothing for me here to learn off of for how to professionally design software. This project I'm working on is for the VP of Supply Chain Management, and he was some sort of higher up software project lead at GE with teams of software engineers working for him. I'm sure he wants the whole damn shebang and is just patiently waiting for me to catch up.
 

Lendarios

Trump's Staff
<Gold Donor>
19,360
-17,424
If he is knowledgeable about the software process, the ER diagram to him should only be the table-table relationships. Then in addition to that the use case scenarios can help give scope to the process. That should give him an idea of what we are trying to do and how are we storing the data and how is the data related to each other.

Regarding the window on the right, that seems to be a view of data, you don't represent that on an ER. You just represent the tables that holds the data.
 

James

Ahn'Qiraj Raider
2,804
7,056
Regarding the window on the right, that seems to be a view of data, you don't represent that on an ER. You just represent the tables that holds the data.

Yeah that's what I thought, but like the whole point of the program is to view the data in that specific way, just not sure what kind of diagram I need to provide to show that. I've now written up a high level use case, but even there I don't really represent that view except as an implication in a short Security section.
 

Lendarios

Trump's Staff
<Gold Donor>
19,360
-17,424
just a mockup, specifying how you want teh data to look. Then the developer makes the program/view to be as close as possible to the mockup.

You can add the mockup screens to the use case scenario.

In a screen like this "blahblah" the user can see the details of the order.
Online Mockup, Wireframe & UI Prototyping Tool · Moqups

try that to mock up your screens.
 
  • 1Solidarity
Reactions: 1 user